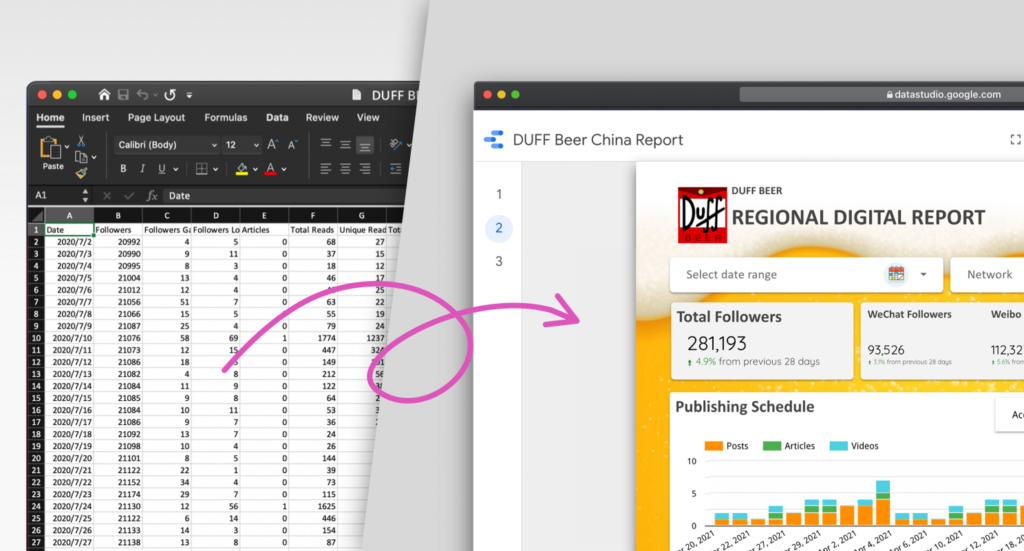
I hate spreadsheets.
If you’ve ever worked with a spreadsheet that contains thousands of rows of data, you feel my pain. Human brains are not capable of identifying trends just by looking at data dumps alone. This is why data really becomes valuable when it’s visualized; charts and graphs remove ambiguity around numbers and instead, tell a story.
Data visualization is a basic skill every marketer should have in their ‘digital toolbox’ and trust me, you don’t have to be a data scientist. There are so many resources available that can help you create awesome social marketing reports with little effort.
One of the most powerful (free!) tools out there is Google Data Studio (GDS), an online tool that allows you to create interactive marketing dashboards.
Why Google Data Studio?
Google Data Studio allows you to pull data from multiple sources into one place. These sources can either come from Google’s own products (e.g. Google AdWords, Search Console, Google Analytics, YouTube Analytics) or through 3rd party ‘Connectors’, that you can easily connect with.
And yes, KAWO has a Google Data Studio connector (find us on Google’s list of partner connectors)! You can now add your China marketing data from WeChat, Weibo, and Douyin into Google Data Studio.
1) All these Data Sources
The beauty of Google Data Studio… you can model your data in a way that will support your business objectives.
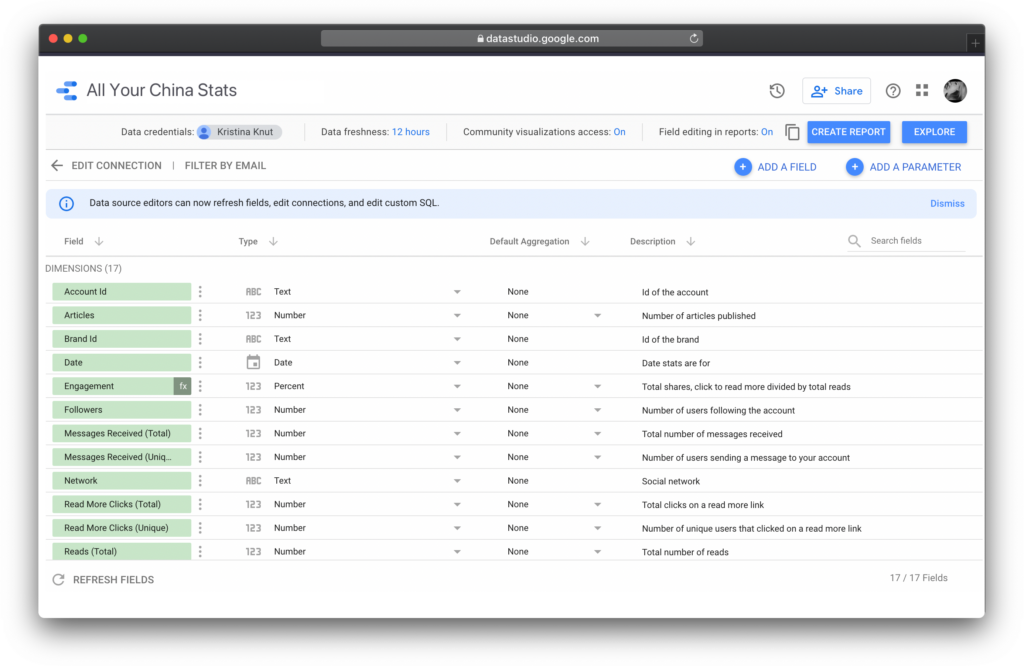
In addition to just adding data sources, GDS also allows you to filter and group your data and to create formulas and calculated metrics.
So, you are able to configure:
- Dimensions: to describe or categorize your data.
- Metrics: to measure your dimensions.
- Calculated fields: any new fields you create by applying functions and operators to your data.
- Parameters: user-defined data to help you customize your reports.
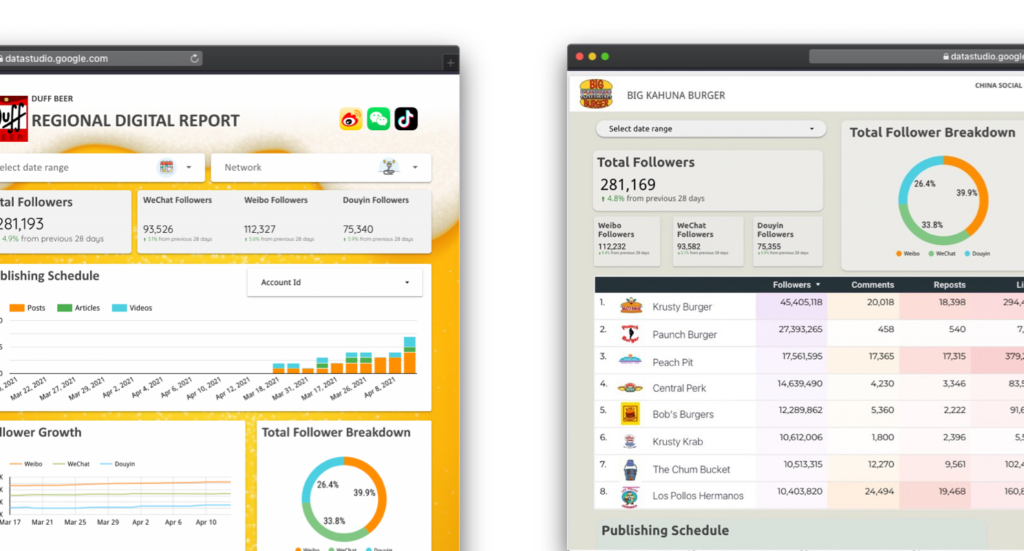
2) You’re in Charge of the Report Design
My favorite part about GDS is how you can design and customize any part of your report. This is especially helpful if you want to add your company’s or client’s logo, add a specialized header, color scheme, and custom fonts.
For new users, the first time creating a report from scratch can be intimidating. Here’s what helped me:
- Ask yourself: what data points should I include? Should the report be interactive or a curated snapshot?
- Sketch it out on a piece of paper first! You’ll likely need a few iterations to find the report structure that will feel right.
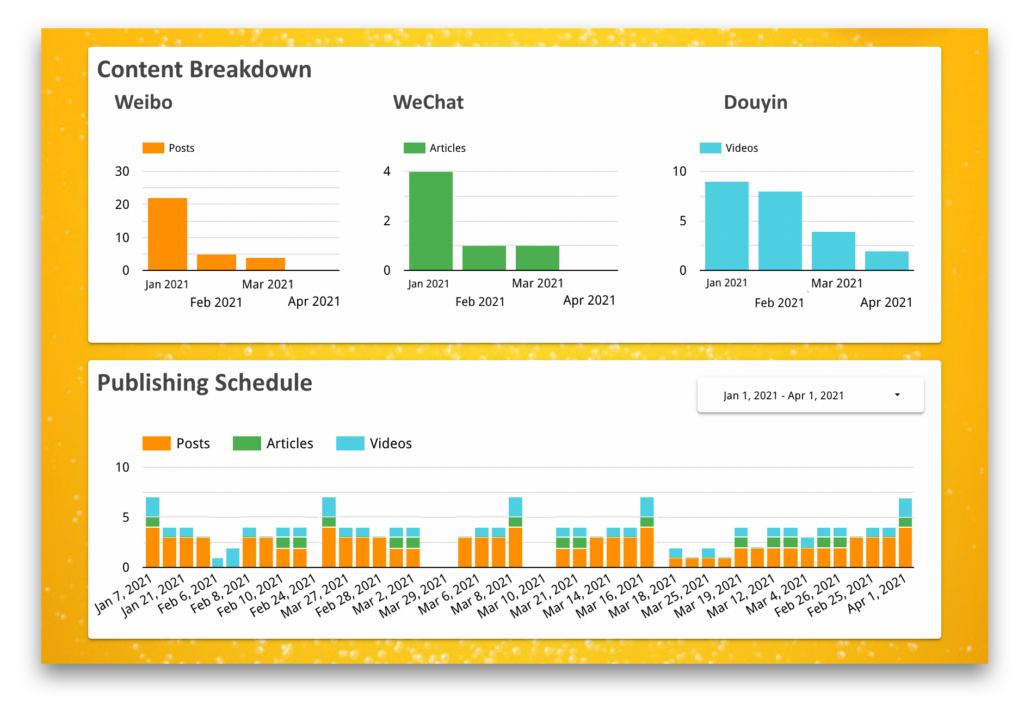
3) Choose the Right ‘Tool’ for the Job
More advanced users will also know that not all charts are made equal. Depending on the story you want to tell, use:
- Line charts to emphasize trends.
- Bar/column charts to show differences.
- Area charts to display differences over time.
Here’s a handy cheat sheet for moments when you have a hard time choosing your next chart.

4) Data Blending
Google Data Studio has a data blending functionality, which lets you analyze data from multiple platforms in a single graph. The only condition is that they have at least one dimension in common.
Your brand does marketing on both TikTok in the West and Douyin in China? Simply use KAWO’s connector to display the data in one single dashboard and compare how these channels perform.
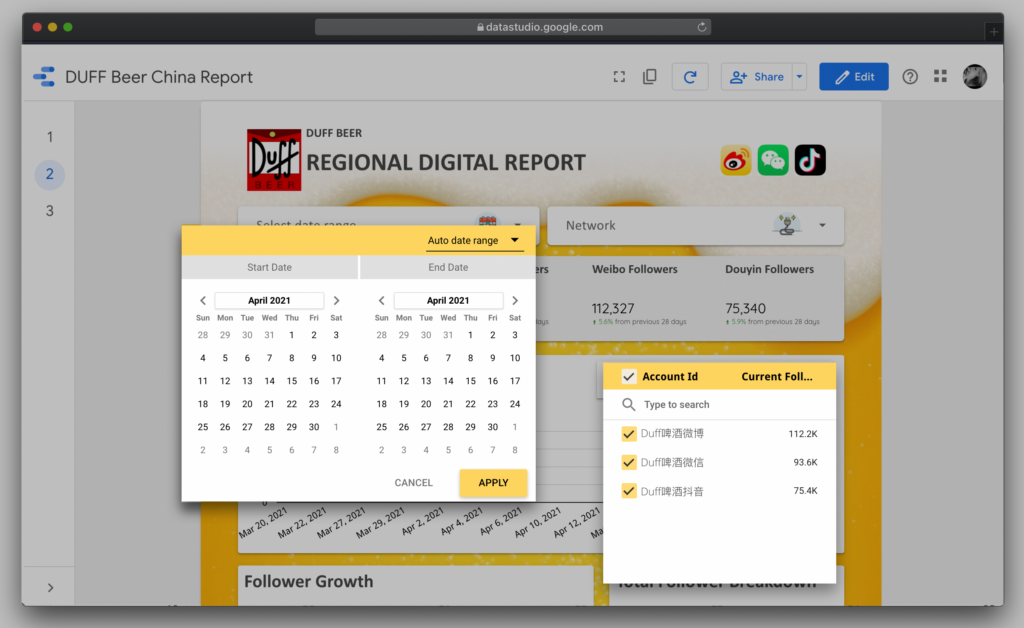
5) Interactive Reports
Instead of your usual static reports, Google Data Studio allows the viewer to interact with the report with elements called ‘Controls’. These are basically filters you can add to each of your reports, and feature drop-down lists, fixed-size lists, input boxes, and sliders.
6) Control Access to Data
Now, with all these interactive elements, you might worry that someone will ‘break’ your carefully crafted report. Google has got you covered. The sharing functions on Google Data Studio are similar to all the other Google products, such as Sheets and Docs — add your co-workers and clients through their email and set their permissions to Editor or Viewer.
As the report owner, you can also restrict others with editing permissions from adding new people to the report and, disable users from downloading, printing, and copying any parts of the report. Or, if you want to share your findings with the world, you can embed the reports into web pages, blog posts, and more.
In addition to the full report, you can limit what data is visible to others by using different credentials:
- Owners Credentials 🔓 using the data source owner’s credentials shared reports will use the same access and allow all report viewers to see data freely.
- Viewers Credentials 🔐 anyone attempting to see the data within the report must have their own login/access to the data set.
The List Goes On!
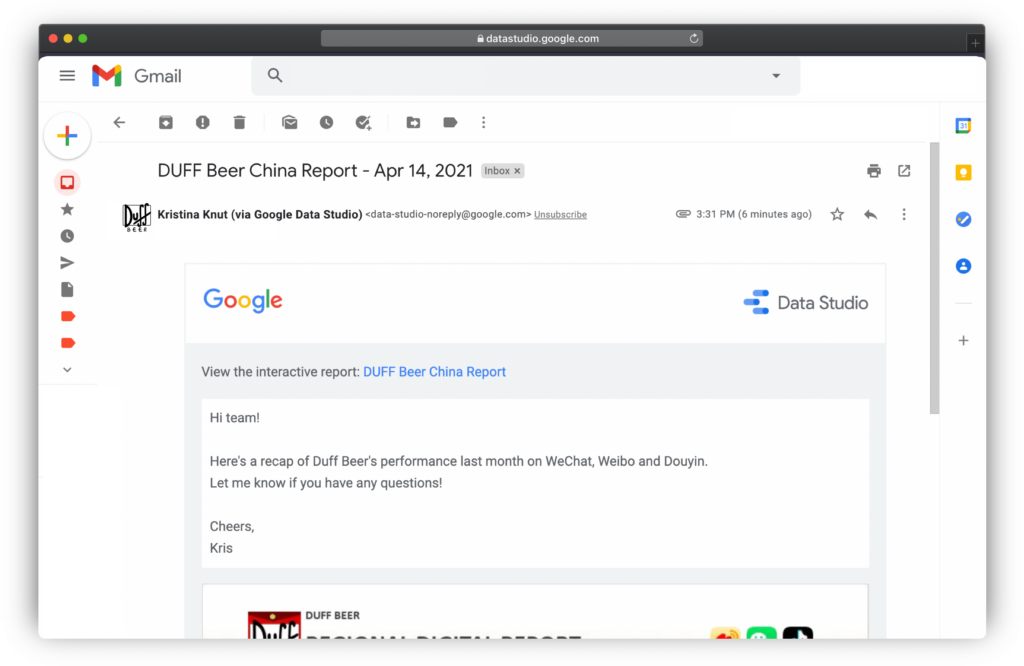
While Google Data Studio has so many other functions, things that really stood out for me were:
- Scheduling: Send PDF reports to selected contacts. You can add custom messages to your emails and choose the frequency for your reports.
- Export to CSV/Sheets: once you’ve used Google Data Studio to assemble your data in a chart, you can export it to CSV or Google Sheets. As the report owner, you can also prevent other people from exporting data from your report.
- Version History: this function keeps a history of your changes in Data Studio and lets you see when a different version was created and by who, allowing you to also restore previous versions of a report or a data source. So, no need to fear that someone will accidentally ‘break’ the report by editing.
User-friendliness at its Core
For digital marketers who want to move beyond the limitations of spreadsheet cells, Google Data Studio is a fantastic tool.
Combine your social data from different sources, add any dimensions and metrics to your reports, and gain a complete picture of your social marketing activities!
Do you have any questions about the China Social Connector from KAWO? Shoot us a message at [email protected]
Happy reporting!


