Many social marketers have the same questions while doing data reports: Is our content more popular than competitors? What’s the best way to measure the performance of brands’ own social media accounts?
Although there are plenty of studies and data on the overall open rate of WeChat Official Accounts (OA), specific researches on the open rate of brands’ official accounts remain missing. That’s why KAWO extracted 18 month of data from KAWO’s own database to help set a clear open rate benchmark to assist marketers in their future efforts.
1. No correlation between followers size and the open rate
It’s natural to develope open rate benchmark hypothesis like ‘smaller accounts may have higher open rates’ … which was the exact angel that we selected when first conducting our research (as shown below):
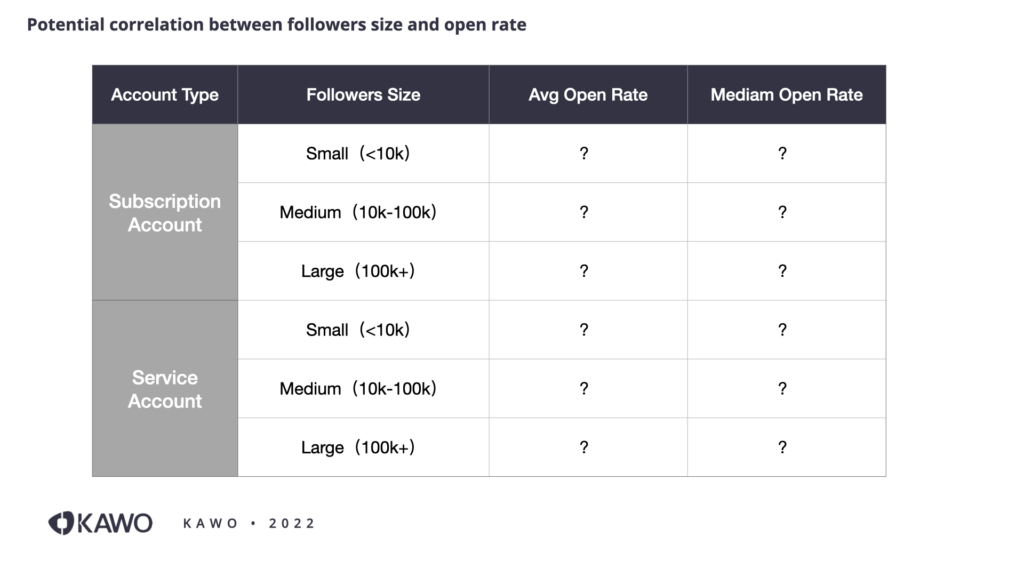
However, after careful and thorough analyses of around 15,000 articles published between January 1, 2021 and July 1, 2022. No clear correlation between the follower number and open rate is discovered, given uncontrollable factors such as post frequencies and post time.
2. What Is a Good Open Rate for WeChat OA?
A mere average of medium number doesn’t really provide marketers too much insight into their OA performance. Instead, we focus on percentiles. It can be used to classify better whether a post’s open rate is poor, low, average, good, great or excellent. See the below chart for detailed definitions.
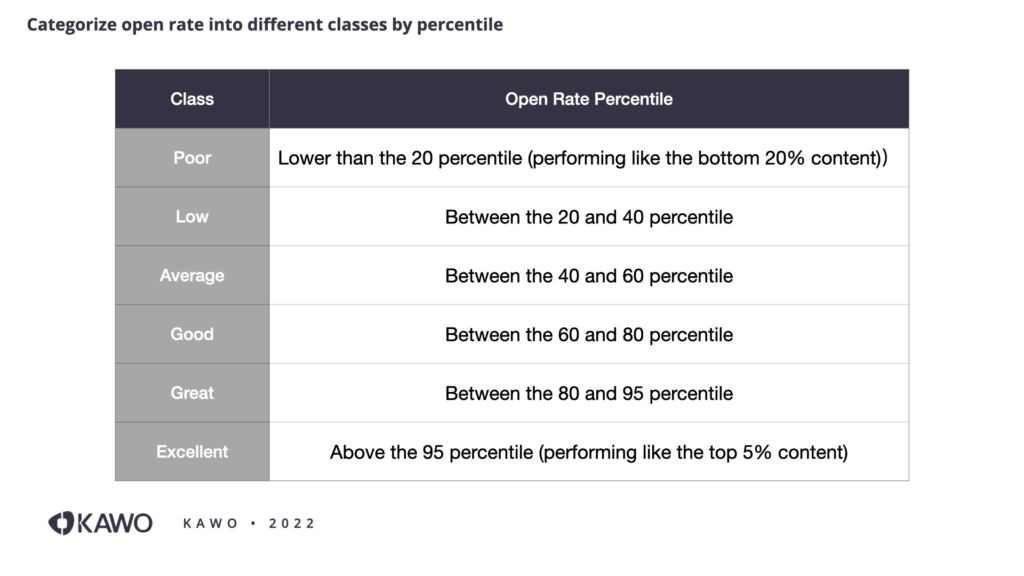
According to the above categorization, we can see clearly the Service Account and Subscription Account open rate trends for accounts of differnt percentiles.
- Posts below the blue line have Poor open rate
- Posts between the blue and green line have Low open rate
- Posts between the green and yellow line have Average open rate
- Posts between the yellow and orange line have Good open rate
- Posts between the orange and purple line have Great open rate
- Posts above the purple line have Excellent open rate
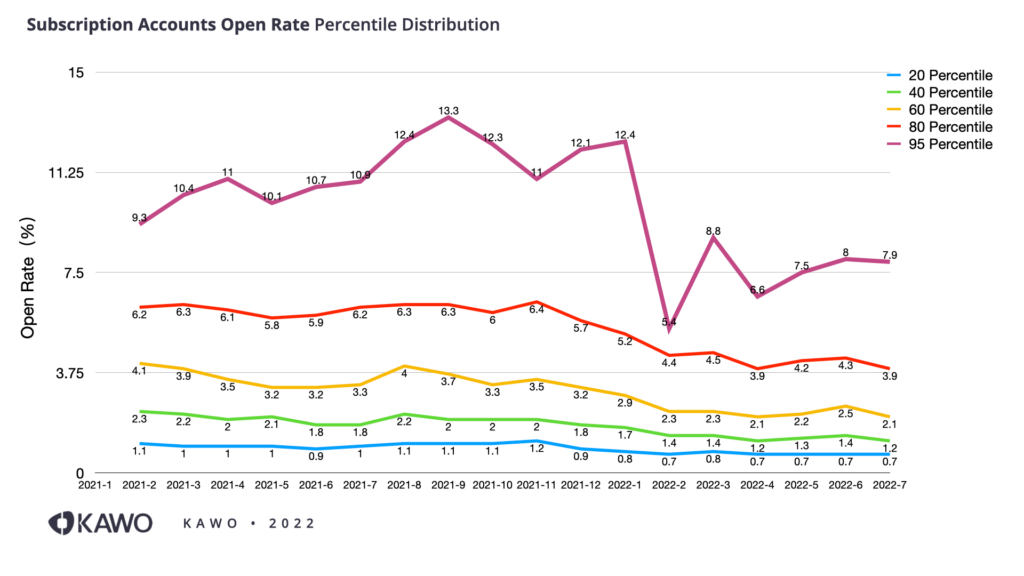
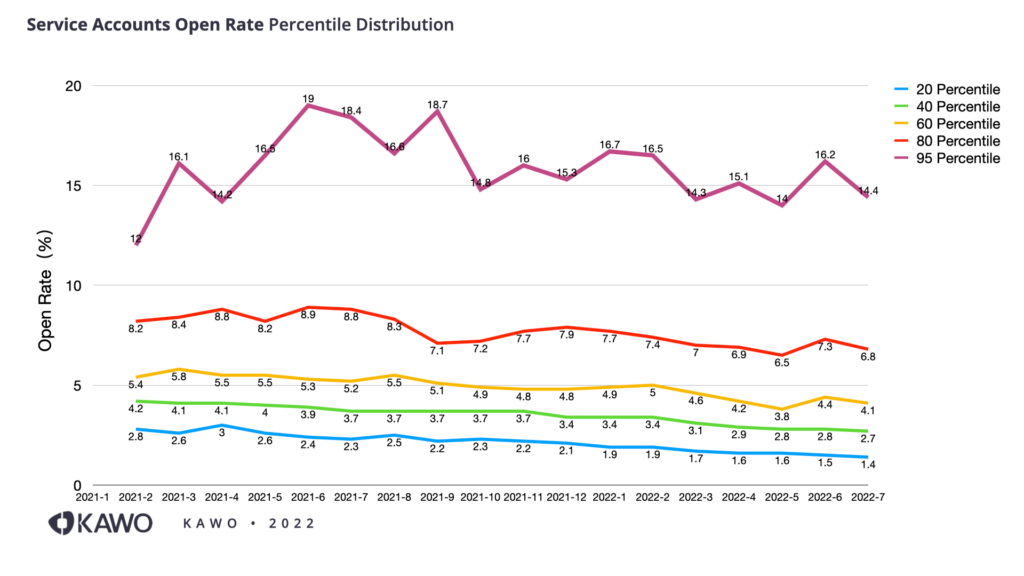
As illustrated in the graphs above, the overall open rates of both subscription and service accounts show a slow downward trend in the past 18 months. The open rate of the “best performing” articles (95% percentile) has the highest fluctuation rate. Compared to service account articles, the open rate of the “best performing” subscription account articles has dropped more. It indicates a more intense competition among subscription accounts
3.Open Rate Benchmark Conclusion:
If your open rate is above 4%, you’ve outperformed most accounts.
Based on the data above, we calculated the average open rate from April to July 2022, and identified the approximate range of open rates for subscription and service accounts corresponding to each performing class. (as shown below)
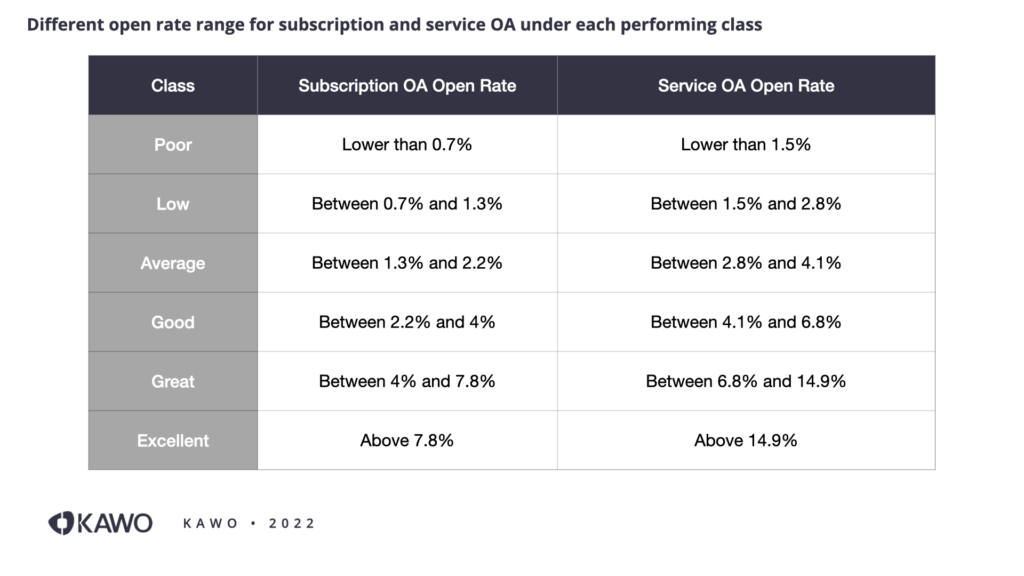
Our conclusions are::
1. The overall open rate for subscription account is lower than that of service account under each class. A 2.2% open rate is “good” by subscription account standard, but it is categorized as “low” for service account.
2. In general, whether it is a service account or a subscription account, an open rate above 4% is considered “well performing.” In the context of the downward trend of the open rate, 4% is quite a success.
*Open rate = the number of reads from push message the article received divided by the number of people the article was sent to
*This article is KAWO‘s original content. KAWO conducted all data extractions and analytics, and has desensitized all statistical samples used in this article. The result do not represent the account data of any single brand. When sharing it, please link back to or mention KAWO to avoid plagiarism.
KAWO is a China social media management platform that helps brands analyze data more efficiently. Click here to learn more about how KAWO can help.


